Linear Regression

2005.03.08 


http://www.barefeetware.com/appleworks/linear_regression/

Description


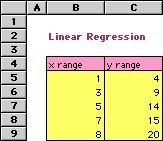
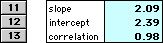
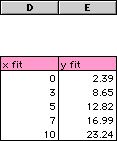
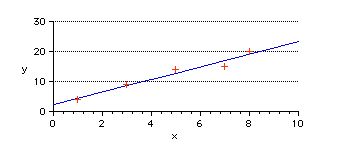
This AppleWorks function script allows a spreadsheet to calculate the slope and intercept of the line that best fits the sample x,y data points, using least squares analysis.

Enhancement
Pack


This is one of 40 scripts in the Enhancement Pack for AppleWorks.


Detail
Calculates the slope, y intercept and correlation coefficient for a least squares fit line through the supplied x,y values. Use a formula in a spreadsheet cell.

The easiest way to do this is to select the “Function...” menu command in the Scripts menu. Choose “linear Regression” from the list, then your choice of:

MACRO("Linear Regression",2,"slope",x_range,y_range)
MACRO("Linear Regression",2,"intercept",x_range,y_range)
MACRO("Linear Regression",2,"correlation",x_range,y_range)

You choose one of the above depending on whether you want to calculate the slope, intercept or correlation of the line of best fit. This will copy the formula to the clipboard for you, ready to paste.

Then, type an “=” in a spreadsheet cell, and paste the formula in. Replace the “x_range” and “y_range” parameters with a refernce to your x and y data.

Sample
To view this sample included with the Enhancement Pack:
    1. Selecting “About AppleWorks Scripts” in the Scripts menu.
    2. Click the “Document” button.
    3. Click the “Script Function Samples” link. A spreadsheet should open containing several sample functions.

Example
The example explains how the above sample was constructed.

For a spreadsheet containing the xy data points:


Create three cells, each with the corresponding Linear Regression MACRO formula (from the Scripts: Universal:Copy Function Script menu):


Select these six cells and select “Auto Name” in the Name Pop-up menu in the Entry Bar. Click “OK” to automatically define “slope” as cell “C11” etc.

To use the slope and intercept to show the line of best fit, you need to add some calculated points next to the data points. Enter any x values, probably spanning your xy data points. For the y calculated cell E5, use the formula “=intercept+slope*D5” and fill down.


To graph the data:
    1. Select the data and calculated points (ie from cell B5 through E9).
    2. Select “Make Chart” in the “Options” menu.
    3. Select “X-Y Line” and OK.

To neaten the chart:
    1. In the legend, click on “series 1”. In the tool (AppleWorks 5) or Accents (AppleWorks 6) palette, set the line width to “None”.
    2. Double-click on “series 2”. Disable the “Symbol” checkbox.
    3. Click the “Labels” button. Disable the “Legend” checkbox. Click OK.


Advanced
Because the functions are dynamically calculated, you can change the xy data points to see the slope and intercept and associated chart update automatically.

Requirements
The “Linear Regression” function can be placed in any cell or calculated field.

This script works with AppleWorks 6 and AppleWorks 5.

Only registered users are permitted to use the supplied files after 14 days or edit them.

Download
This script is included in the Enhancement Pack for AppleWorks, not supplied separately.

Scripting
To make the script editable, drag and drop it onto the “Show/Hide in Scripts Menu” applet in the Scripts Support folder, then double click to open in your script editor. After closing the script, drop it on the applet again to hide it in the AppleWorks menu.

The script caches the results of all calculations when first called, recalculating only if the input xy values are changed. This speeds calculation of the second and third parameters.

Some of the major instructions are:

repeat with pointN from 1 to n
   set x to item pointN in xList as number
   set sumX to sumX + x
...
   set sumXY to sumXY + x * y
   set sumX2 to sumX2 + x ^ 2
end repeat
set denominator to n * sumX2 - sumX ^ 2
set interceptVal to (sumY * sumX2 - sumX * sumXY) / denominator

Please email us any queries about this page.